

Radar Informacji
Real-time topic detection, semantic clustering, and trend intelligence for live news streams
What is Radar Informacji?
Radar Informacji is an automated research system designed to discover, track, and analyze information trends across digital news media. Every day, it ingests hundreds of incoming articles, clusters semantically related reports, synthesizes objective summaries, and traces media origin and sentiment.
Unlike traditional categorical news aggregators, Radar Informacji does not rely on fixed, predefined categories (such as “Politics” or “Business”). Instead, topic boundaries and names emerge directly from the text data via unsupervised density clustering and embedding similarity.
The platform is 100% free, non-profit, ad-free, and requires no login or registration.
The 8-Stage Machine Learning Pipeline
Daily summaries and clustering are produced by a deterministic 8-step pipeline:
[ 1. Web Stream ] ──> [ 2. JSONL Export ] ──> [ 3. 512D Embeddings ]
                                                         │
[ 6. GenAI Labels ] <── [ 5. HDBSCAN ] <── [ 4. t-SNE / UMAP ]
         │
         ▼
[ 7. Summary Synthesis (~700 chars) ] ──> [ 8. Similar Days (Bi-Encoder) ]
Stage 1: News Ingestion & Normalization
A continuous web crawler collects articles and headlines from diverse Polish and international news outlets, creating an unfiltered daily raw stream.
Stage 2: JSONL Data Standardization
Raw items are cleaned and serialized into structured JSONL with key metadata:
{
  "text": "Article content or headline text...",
  "metadata": {
    "language": "pl",
    "polarity_3c": "positive",
    "source": "OutletName",
    "news_url": "https://..."
  }
}
Stage 3: Dense Feature Representation (Sentence-Transformers)
Each document is encoded into a 512-dimensional embedding using a Sentence-Transformers model fine-tuned for Polish syntax and semantics: * Inputs beyond 508 tokens are safely truncated, * Embeddings undergo L₂ normalization for direct cosine metric computations, * High-throughput batch inference (batch size 500) maximizes GPU throughput.
Stage 4: Non-linear Dimensionality Reduction
The high-dimensional vector space is projected down using Barnes-Hut t-SNE or UMAP, preserving both localized clustering manifolds and global topological distance between disparate topics.
Stage 5: Dynamic HDBSCAN Optimization
Rather than applying a static distance threshold, the pipeline evaluates 32 distinct values of the min_cluster_size hyperparameter (ranging from 5 to 60):
* The selection heuristic targets an optimal range of 25–45 daily topic clusters (with a sweet spot around 35),
* Tie-breaking logic automatically chooses the parameter set that minimizes unassigned outlier noise.
Stage 6: Generative Topic Labelling
Articles grouped into each cluster are fed into a generative language model that identifies the core subject and produces an accurate, descriptive title (e.g., “Artemis Space Program — Progress and Engine Tests”).
Stage 7: Abstractive Synthesis (~700 chars)
The model synthesizes a concise, factual summary of approximately 700 characters, followed by an automated linguistic and spelling verification pass.
Stage 8: Similar Days Retrieval (Bi-Encoder)
Daily vector footprints are embedded via article-bi-encoder-20240901. Cosine similarity matching over historical records retrieves up to 10 most similar events from the day before.
User Interface & Dashboard Overview
The Radar Informacji interface combines 2D semantic manifold projection with interactive daily topic cards:
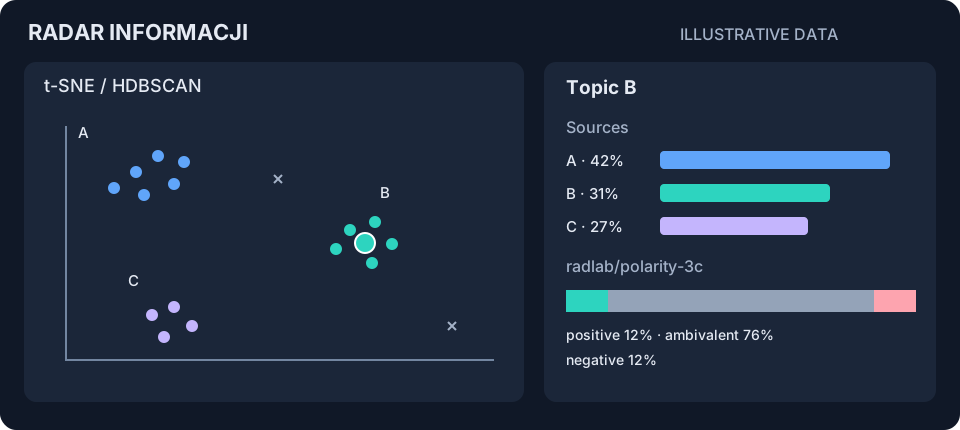
Explore real topics and charts in Radar Informacji.
Analytical Features
- Source Propagation Breakdown: Visualizes portal distribution for each topic, revealing which publications originated or amplified the news.
- Sentiment & Polarity Distribution: Evaluates emotional tone (positive, negative, ambivalent) across the cluster using
radlab/polarity-3c. - Historical Calendar Archive: Navigate back to previous dates to trace how stories developed over time.
- Information Explorer & Graphs: Graph-based entity and relationship extraction for in-depth intelligence discovery.
Access & Links
- Live Application: radar.apps.radlab.dev
- Algorithm Documentation: radar.apps.radlab.dev/algorithm
- Availability: Free and open for research, analysis, and educational use.